Use the ECG view tools
NilRead provides several tools that can be used to adjust the visualization of ECG images. To access these tools, select View Tools (side panel).
Gain and Timescale
You can adjust the gain and timescale for the graph to better define the waveforms.
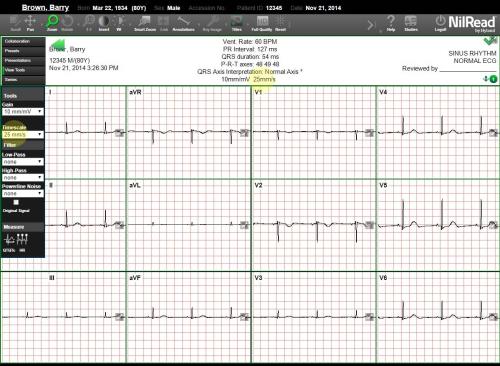
Use Gain to change the height (amplitude) shown on the vertical axis. The current Gain value is shown in the center of the information bar. (Standard calibration for an ECG is 10mm/mV.)
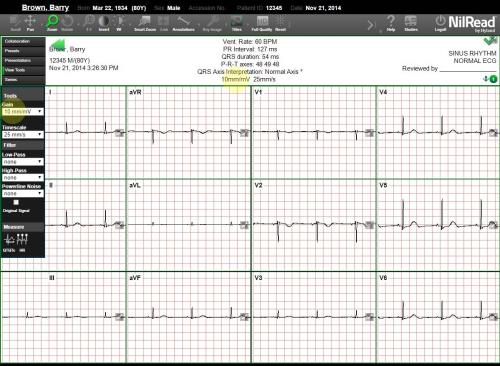
Use Timescale to adjust the timescale shown on the horizontal axis. The current Timescale value is shown in the center of the information bar. (Standard timescale for an ECG is 25 mm/s.)
Filter
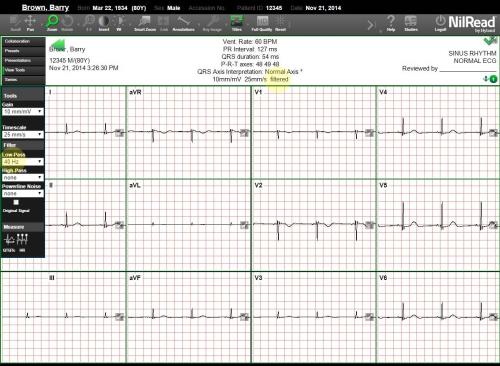
Use Filter to remove unwanted artifacts and noise from the ECG recording. You can use the following filters:
- Low-Pass Remove high frequency interference.
- High-Pass Remove lower frequency interference.
- Powerline Noise Remove powerline interference. Powerline interference may result from factors such as electromagnetic interference by power lines or nearby machinery.
- Original Signal Show the original signal and the filtered signal at the same time.
If a filter is applied, this is stated in the center of the information bar.
HR
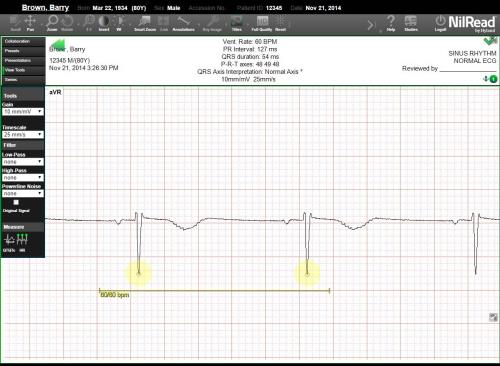
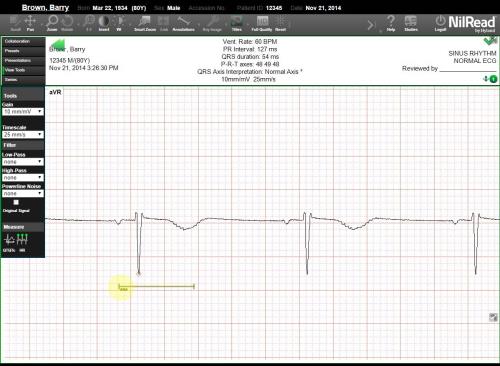
Use the HR tool to calculate the number of heart beats per minute (bpm) between two points on a graph.
Click (or tap) and drag to create a line. After the line is drawn, the bpm is calculated and displayed. This calculation is based on the wave peaks included in the interval covered by the line. The peaks included in the calculation are circled.
The first number in the calculation represents the number of heart beats in the interval covered by the line. The second number represents the number of heart beats for the entire signal. A regular heartbeat will have the same values for the interval time and total time (for example: 80/80). An irregular heartbeat will have different values.
At least two peaks are required to calculate the heart rate for an interval. If less than two peaks are included in the interval, *** will be shown, indicating that the heart rate could not be calculated.
To delete a line, right-click the line, then select Delete.
QTQTc
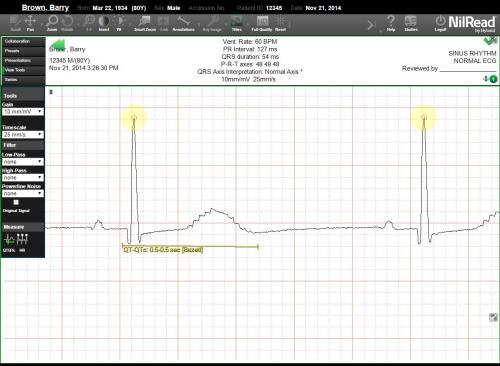
Use the QTQTc tool to measure the QT interval. NilRead also calculates the corrected QT interval (QTc). The QTc is calculated based on Bazett's formula.
- Using lead II or V5-6, draw a line from the start of the Q wave to the end of the T wave. The QT and QTc are shown.
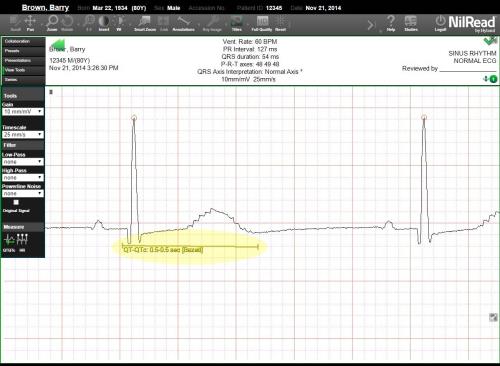
- The two R peaks in the QT interval are circled. The first R peak is between the Q and P waves. The second R peak is used as a reference point.
If the line does not cover the required to calculate the QT interval, *** will be shown, indicating that the QT and QTc could not be calculated.
To delete a line, right-click the line, then select Delete.
Annotation Tools
There are some differences in how measurements are shown when using regular annotation tools with ECG images.
Linear and Area Measurements
For linear measurement tools (such as the ruler) and area measurement tools (such as the rectangle), horizontal measurements are shown in seconds and vertical measurements are shown in mV.
Angle
The measurement for an angle shows the time and signal value between the two points.